

Startup Advisory
Strategic financial guidance for pre-seed to Series A founders

-
1-Hour AMA
-
Investor Readiness Review
-
Financial Model Review
-
Pitch Deck + Metrics Review
-
Monthly Founder Advisory
About Kirsten Barrie
Kirsten Barrie brings more than 20 years of CFO experience to pre-seed through Series A startups.
Through Verte, she advises founders on financial modeling, investor readiness, and the financial strategy behind stronger fundraising and growth decisions.
Her background includes bi-monthly webinars at Startups.com on startup and financial modeling topics, founder mentoring, VC scouting, and building financial models that have supported successful raises.
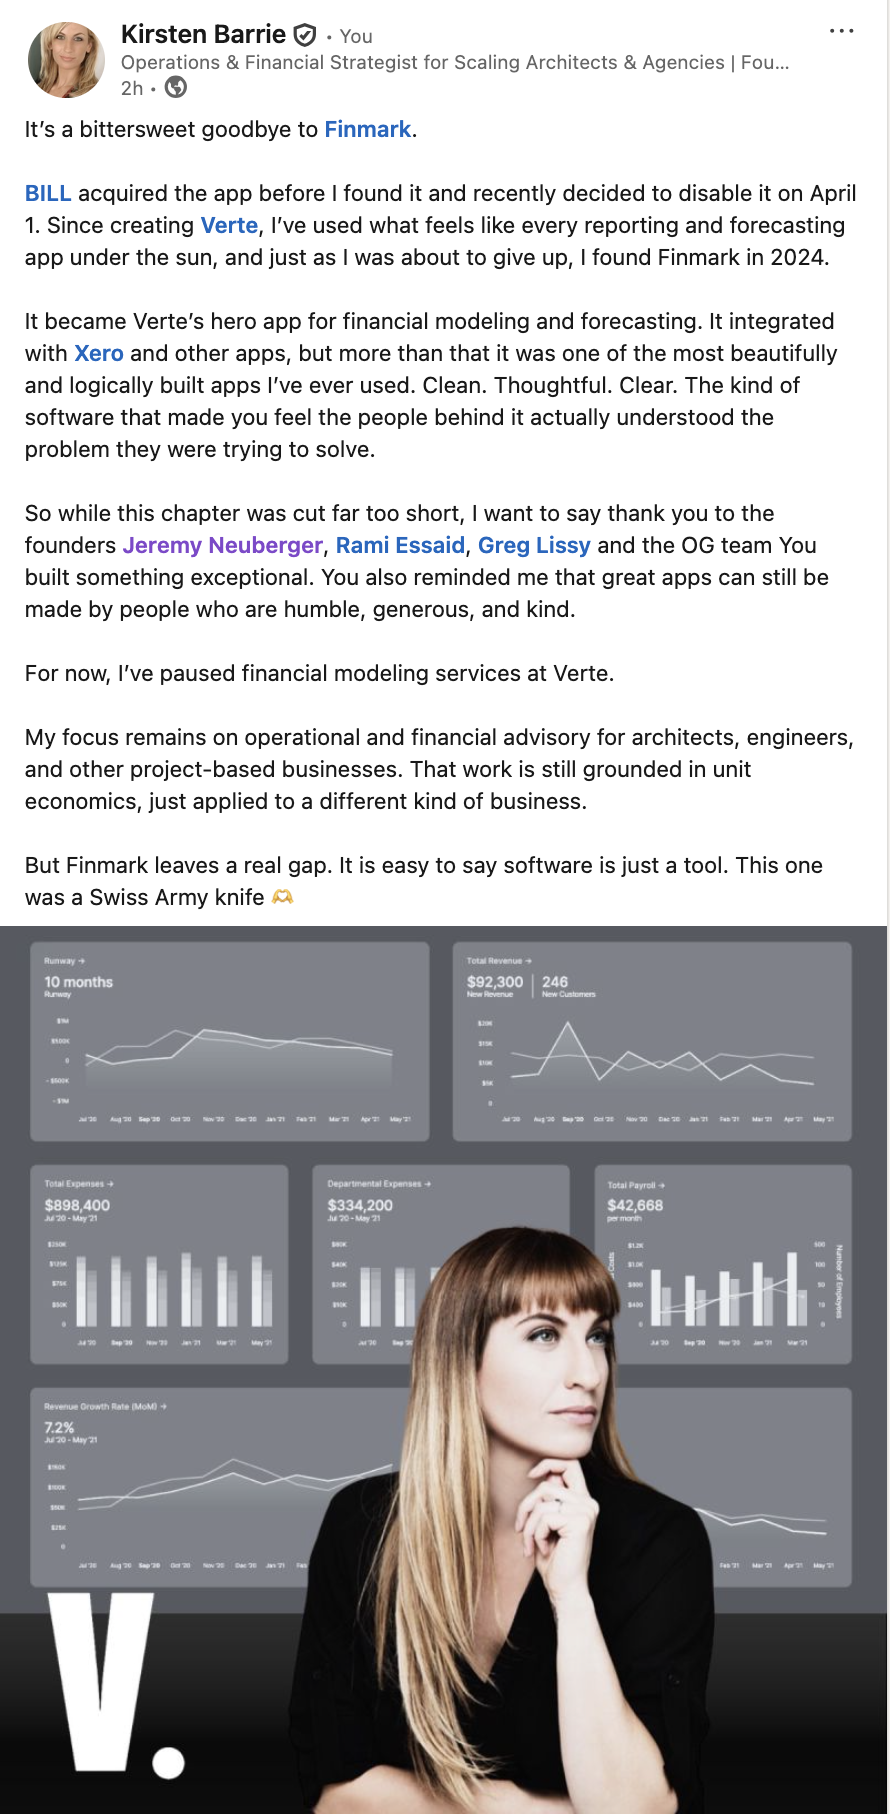
Our hero product, Finmark, has been taken offline.
We are sad to say goodbye
Forecast with Confidence.
Raise with Clarity.
What (was) Included
Custom Financial Model in Finmark
• A custom financial model in Finmark with CAC, LTV, runway, burn, revenue, and headcount forecasting - tailored to your product, pricing model, and GTM plan
• Optional modeling of pricing strategy, fundraising timing, sales ramp, and marketing spend allocation


Seamless Integration Setup
We’ll connect your Finmark account to Xero, Gusto, Stripe, or other tools so you can pull in live data. (You’ll pay Finmark directly for your subscription.)


• Collaborative onboarding sessions: we gather your metrics, map assumptions, and refine the logic together
• One built-in scenario (typically base case); additional scenarios (e.g., best/worst case, hiring ramp, fundraising timing) available as add-ons
Optional: Quarterly Investor Report
We can also create standardized Pro Forma quarterly reports (Income Statement, Balance Sheet, Cash Flow) after your model is live.
A flexible model you can update and expand as your business grows, without starting from scratch!
Who This (was) For
SaaS founders post-seed through Series A who need financial clarity to raise or scale
Startups without an internal finance lead - but with real traction and decisions to make
Founders struggling with messy spreadsheets, unclear CAC, or investor questions they can't confidently answer
Most models are under built, disconnected, or inaccurate.
Verte gives you:
End-to-end logic from CAC to EBITDA
Clean, usable outputs you can actually operate with
Founder-focused insights, not just finance speak
A dynamic model you can continue to use that compares real-world activity next to your forecast
We don’t hand off a black box. We build a model you’ll understand and actually use.
Why Verte vs Spreadsheet Bros

Founder’s Note
I created this service after years of watching founders get stuck between clunky spreadsheets and overpriced fluff. Spreadsheets didn’t scale and are not dynamic.
I care that you get it. That you feel equipped, not overwhelmed. That you can use your model as year over year forecasting. That is results in a sold business model with defensible unit metrics.
Financial clarity isn’t just for fundraising - it’s how you scale without chaos.